3QFY2018 Result Update | Banking
February 15, 2018
ICICI Bank
BUY
CMP
`328
Performance Highlights
Target Price
`416
Particulars (` cr)
3QFY18
2QFY18
% chg (qoq) 3QFY17
% chg (yoy)
Investment Period
12 Months
NII
5,705
5,709
(0.1)
5,364
6.4
Pre-prov. profit
5,057
6,986
(27.6)
5,524
(8.5)
Stock Info
PAT
1,650
2,058
(19.8)
2,442
(32.4)
Sector
Banking
Source: Company, Angel Research
Market Cap (` cr)
2,11,094
ICICI Bank PAT for the 3QFY18 declined 32% yoy to `1,650cr affected by higher
Beta
1.6
provision and weak other income. Key positive during the quarter was the
52 Week High / Low
365.7/241
divergence with RBI as FY17 NPA was lower than the threshold required for
Avg. Daily Volume
11,43,723
disclosure.
Face Value (`)
2
Healthy growth in retail advances
BSE Sensex
34,300
During 3QFY18, the bank’s advances grew by 10.5% yoy (4.7% qoq), aided by
Nifty
10,546
Reuters Code
ICBK.NS
healthy retail loan book growth of 22.4% yoy. The main drivers leading to the
Bloomberg Code
ICICIBC@IN
growth in the retail loan book were Personal loans and credit card loan, which
grew by 44.7% and 26.9% yoy respectively. Retail contribution to total loans
increased to 54% as compared to 49% in the corresponding quarter of the
Shareholding Pattern (%)
previous year. The corporate loan book grew 4.6% yoy (3.5% qoq).
Promoters
NA
Deposits growth was modest at 11% yoy, while CASA deposits saw a growth of
MF / Banks / Indian Fls
42.1
12.4% yoy, resulting in improvement in CASA ratio by 0.52bp yoy to 50.4%. The
Reported NIM fell by 13bp qoq to 3.14%, with domestic NIM at 3.53% as
FII / NRIs / OCBs
47.3
compared to 3.57% in 2QFY18. The Compression in NIM largely owing to
Indian Public / Others
10.6
international operation.
On the asset quality front, the bank witnessed slippages during the quarter to the
Abs. (%)
3m 1yr
3yr
tune of `4,380cr (annualized slippage ratio at 3.5% Vs 3.9 in Q2FY18). The Gross
NPA ratio fell 5bp sequentially to 7.82%, whereas the Net NPA declined 23bp qoq
Sensex
3.7
20.6
17.0
to 4.2%. In Q4FY18 bank has to take additional provision for NCLT-2, current
ICICI Bank
4.2
28.3
5.2
provision held at 36.4% whereas RBI requirement is 50%. Total exposure wherein
stands at `11,400cr spread over 16 accounts.
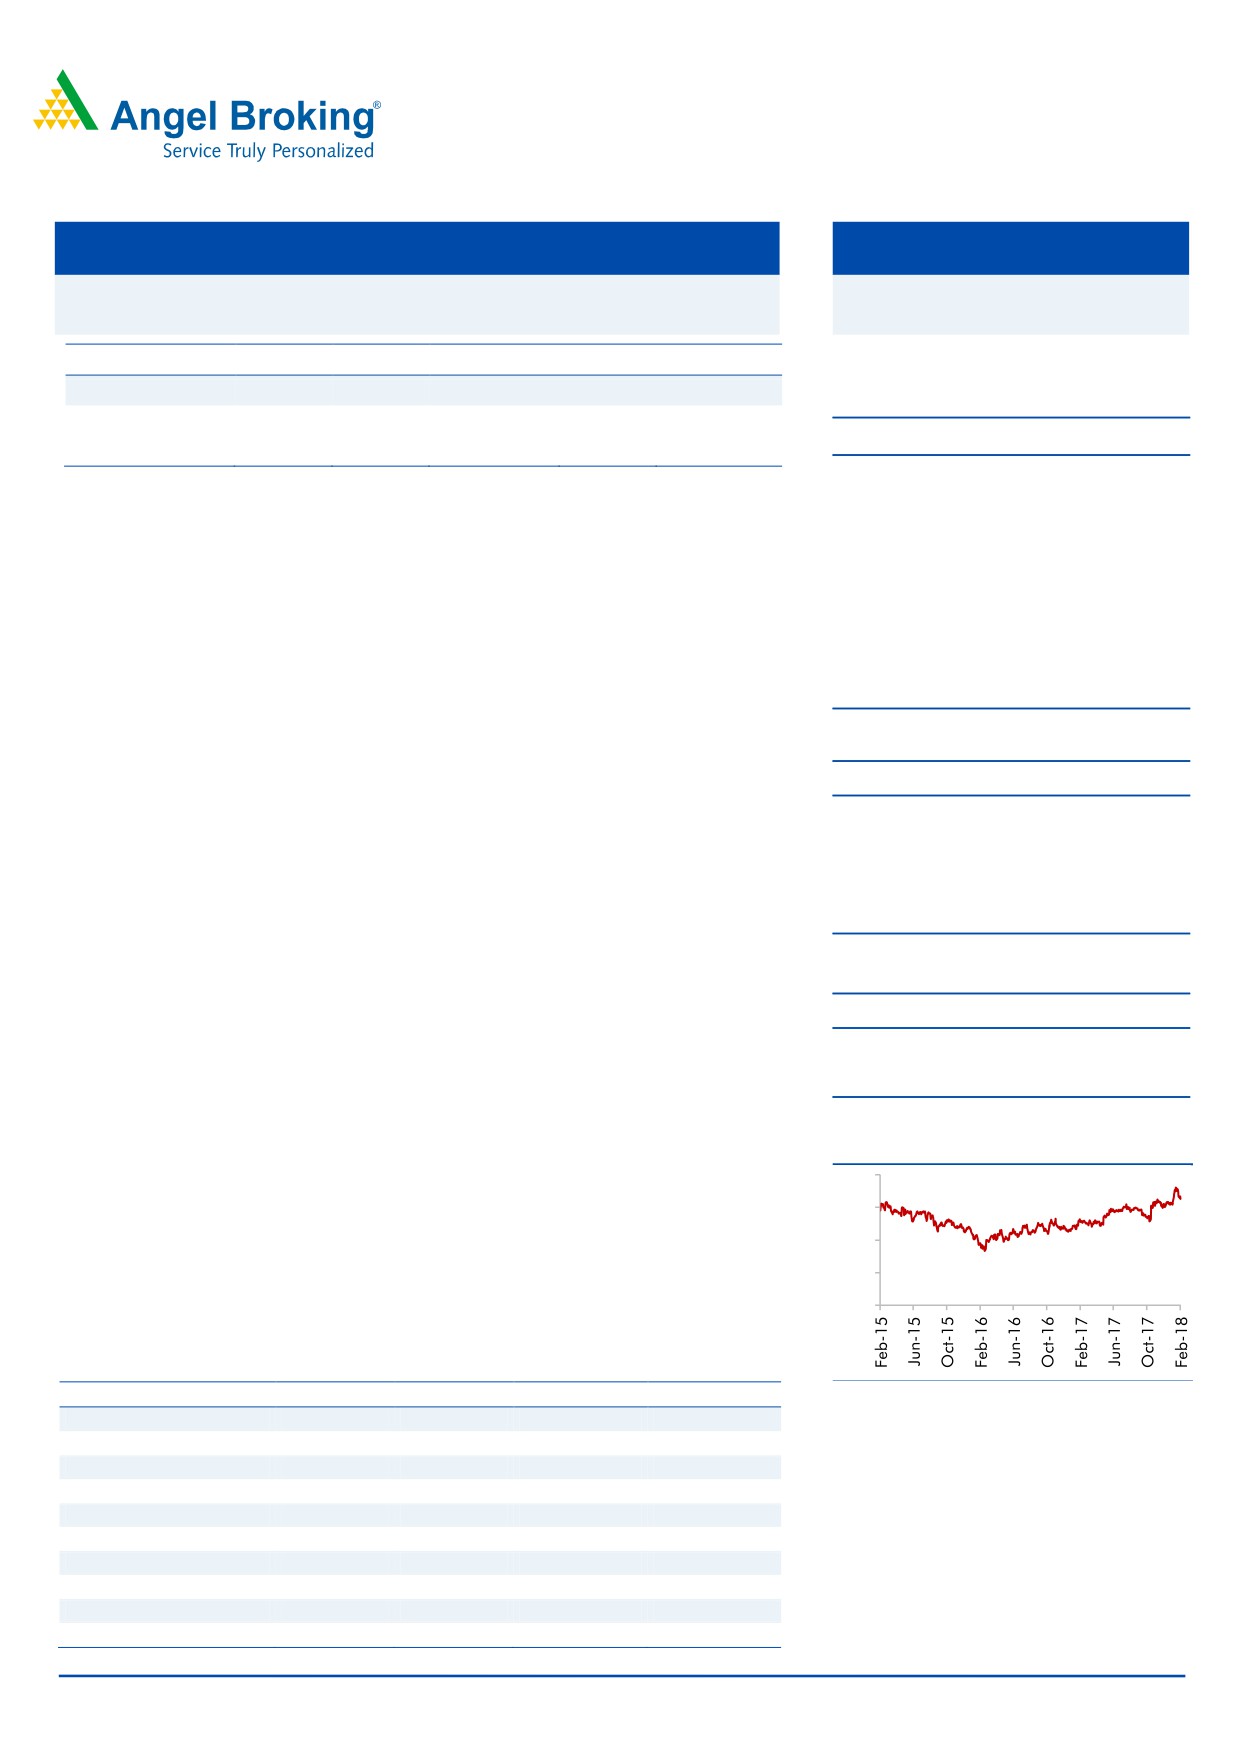
3-year price chart
Outlook & Valuation: At the current market price, the bank’s core banking
400
business (after adjusting value of subsidiaries) is trading at 1.1x FY20E ABV. We
300
believe strength of liability franchise (CASA-50%), shift in loan mix towards retail
200
assets and better rated companies, Strong capitalization (tier I of 14.6%), and
100
steady improvement in stress loan and going forward quick resolution under IBC
0
would be the key trigger for multiple expansion. We recommend a Buy rating on
the stock, with a target price of `416.
Key financials (Standalone)
Source: Company, Angel Research
Y/E March (` cr)
FY2017
FY2018E
FY2019E
FY2012E
NII
21,738
22,992
26,390
30,871
% chg
2
6
15
17
Net profit
9,802
7,726
9,382
14,185
% chg
0.8
(21.2)
21.4
51
NIM (%)
3.2
3.1
3.2
3.2
EPS (`)
15
12
15
22
P/E (x)
22
27
22
15
Jaikishan Parmar
P/ABV (x)
3
2
2
2
022 - 39357600 Ext: 6810
RoA (%)
1.3
1.0
1.0
1.4
RoE (%)
10
8
9
12
Source: Company, Angel Research; Note: CMP as of February 15, 2018
Please refer to important disclosures at the end of this report
1
ICICI Bank | Q3FY2018 Result Update
Exhibit 1: 3QFY2018 performance (Standalone)
Particulars (` cr)
2QFY17
3QFY17
4QFY17
1QFY18
2QFY18
3QFY18
% YoY
% QoQ
Interest earned
13,639
13,618
13,569
13,459
13,577
13,665
0.3
0.6
- on Advances / Bills
9,905
9,870
9,991
9,847
10,090
10,238
3.7
1.5
- on investments
2,997
2,948
2,622
2,827
2,879
2,860
(3.0)
(0.7)
- on balance with RBI & others
38
126
282
199
145
154
22.7
6.4
- on others
699
675
674
586
463
412
(38.9)
(10.9)
Interest Expended
8,386
8,254
7,606
7,869
7,868
7,960
(3.6)
1.2
Net Interest Income
5,253
5,364
5,962
5,590
5,709
5,705
6.4
(0.1)
Other income
9,119
3,938
3,017
3,388
5,186
3,167
(19.6)
(38.9)
- Fee income
2,356
2,495
2,446
2,377
2,570
2,639
5.8
2.7
- Treasury income
6412
893
503
858
2193
66
(92.6)
(97.0)
- Others
351
550
68
153
423
462
(16.0)
9.2
Operating income
14,372
9,302
8,979
8,978
10,895
8,872
(4.6)
(18.6)
Operating expenses
3,736
3,778
3,867
3,794
3,909
3,814
1.0
(2.4)
- Employee expenses
1,556
1,406
1,480
1,511
1,514
1,363
(3.1)
(10.0)
- Other Opex
2,180
2,372
2,387
2,283
2,395
2,452
3.4
2.4
Pre-provision Profit
10,636
5,524
5,112
5,184
6,986
5,057
(8.5)
(27.6)
Provisions & Contingencies
7082
2712.7
2898
2608.74
4502.93
3569.56
31.6
(20.7)
PBT
3,554
2,812
2,214
2,575
2,483
1,488
(47.1)
(40.1)
Provision for Tax
451
369
189
526
425
-162
(143.9)
(138.1)
PAT
3,103
2,442
2,025
2,050
2,058
1,650
(32.4)
(19.8)
Effective Tax Rate (%)
12.7
13.1
8.5
20.4
17.1
-10.9
Source: Company, Angel Research
Exhibit 2: Strong Retail lending supports Loan Growth
Particulars (` cr)
2QFY17
3QFY17
4QFY17
1QFY18
2QFY18
3QFY18
% YoY
% QoQ
Domestic Corporate
1,25,829
1,29,921
1,26,735
1,24,372
1,31,316
1,35,949
4.6
3.5
Overseas branches
91,305
82,802
74,741
71,468
71,934
70,754
(14.6)
(1.6)
SME
19,533
21,044
22,283
20,883
20,760
24,764
17.7
19.3
Retail Total
2,17,588
2,23,703
2,40,472
2,47,352
2,58,770
2,73,920
22.4
5.9
Total
4,54,255
4,57,469
4,64,232
4,64,075
4,82,780
5,05,387
10.5
4.7
Loan Mix (%)
Domestic Corporate
28
28
27
27
27
27
Overseas branches
20
18
16
15
15
14
SME
4
5
5
5
4
5
Retail Total
48
49
52
53
54
54
Source: Company, Angel Research
During 3QFY2018, the bank’s advances grew by 10.5% yoy (4.7% qoq), aided by
healthy retail loan book growth of 22.4% yoy. The main drivers leading to the
growth in the retail loan book were Personal loans and credit card loan, which
grew by 44.7% and 26.9% yoy respectively. Retail contribution to total loans
increased to 54% as compared to 49% in the corresponding quarter of the
previous year. The corporate loan book grew 4.6% yoy (3.5% qoq).
February 15, 2018
2
ICICI Bank | Q3FY2018 Result Update
Exhibit 3: Asset Quality Analysis
Particulars (` cr)
2QFY17
3QFY17
4QFY17
1QFY18
2QFY18
3QFY18
% YoY
% QoQ
Opening gross NPA
27,563
32,548
38,085
42,552
43,148
44,489
36.7
3.1
Add: gross additions
8,089
7,037
11,289
4,976
4,674
4,380
(37.8)
(6.3)
Slippages (%)
1.8
1.5
2.4
1.1
1.0
0.9
Closing gross NPAs
32,548
38,085
42,552
43,148
44,489
46,039
20.9
3.5
GNPA (%)
6.12
7.2
7.89
7.99
7.87
7.82
Less - Provision
16,065
17,930
17,101
17,842
20,359
22,229
24.0
9.2
Net NPAs
16,483
20,155
25,451
25,306
24,130
23,810
18.1
(1.3)
Net NPA (%)
3.2
4.0
4.9
4.9
4.4
4.2
PCR
49
47
40
41
46
48
Standard Restructured
6,300
6,400
4,300
2,400
2,000
1,800
(71.9)
(10.0)
Std. Rest. Adv. as % of Loan Book
1.4
1.4
0.9
0.5
0.4
0.4
Exhibit 4: Declining trend in sub-investment grade exposures
Exposure
% of total
Exposure
% of total
Exposure
% of total
Exposure
% of total
Exposure at
% of total
Particulars (` cr)
at 3QFY17
Exposure
at 4QFY17
Exposure
at 1QFY18
Exposure
at 2QFY18
Exposure
3QFY18
Exposure
Sector
Power
8,350
0.9
6,230
0.7
7,080
0.8
6,840
0.7
6,530
0.7
Mining
5,550
0.6
5,230
0.6
5,590
0.6
5,750
0.6
5,780
0.6
Iron/Steel
4,490
0.5
3,970
0.4
3,990
0.4
4,010
0.4
4,430
0.4
Others (cement, rigs, etc.)
5,680
0.6
290
-
320
-
410
0.3
420
-
Promoter entities
3,420
0.4
3,270
0.3
3,330
0.4
2,580
0.3
1,920
0.2
Total
27,490
3.0
18,990
2.0
20,310
2.2
19,590
2.3
19,080
1.9
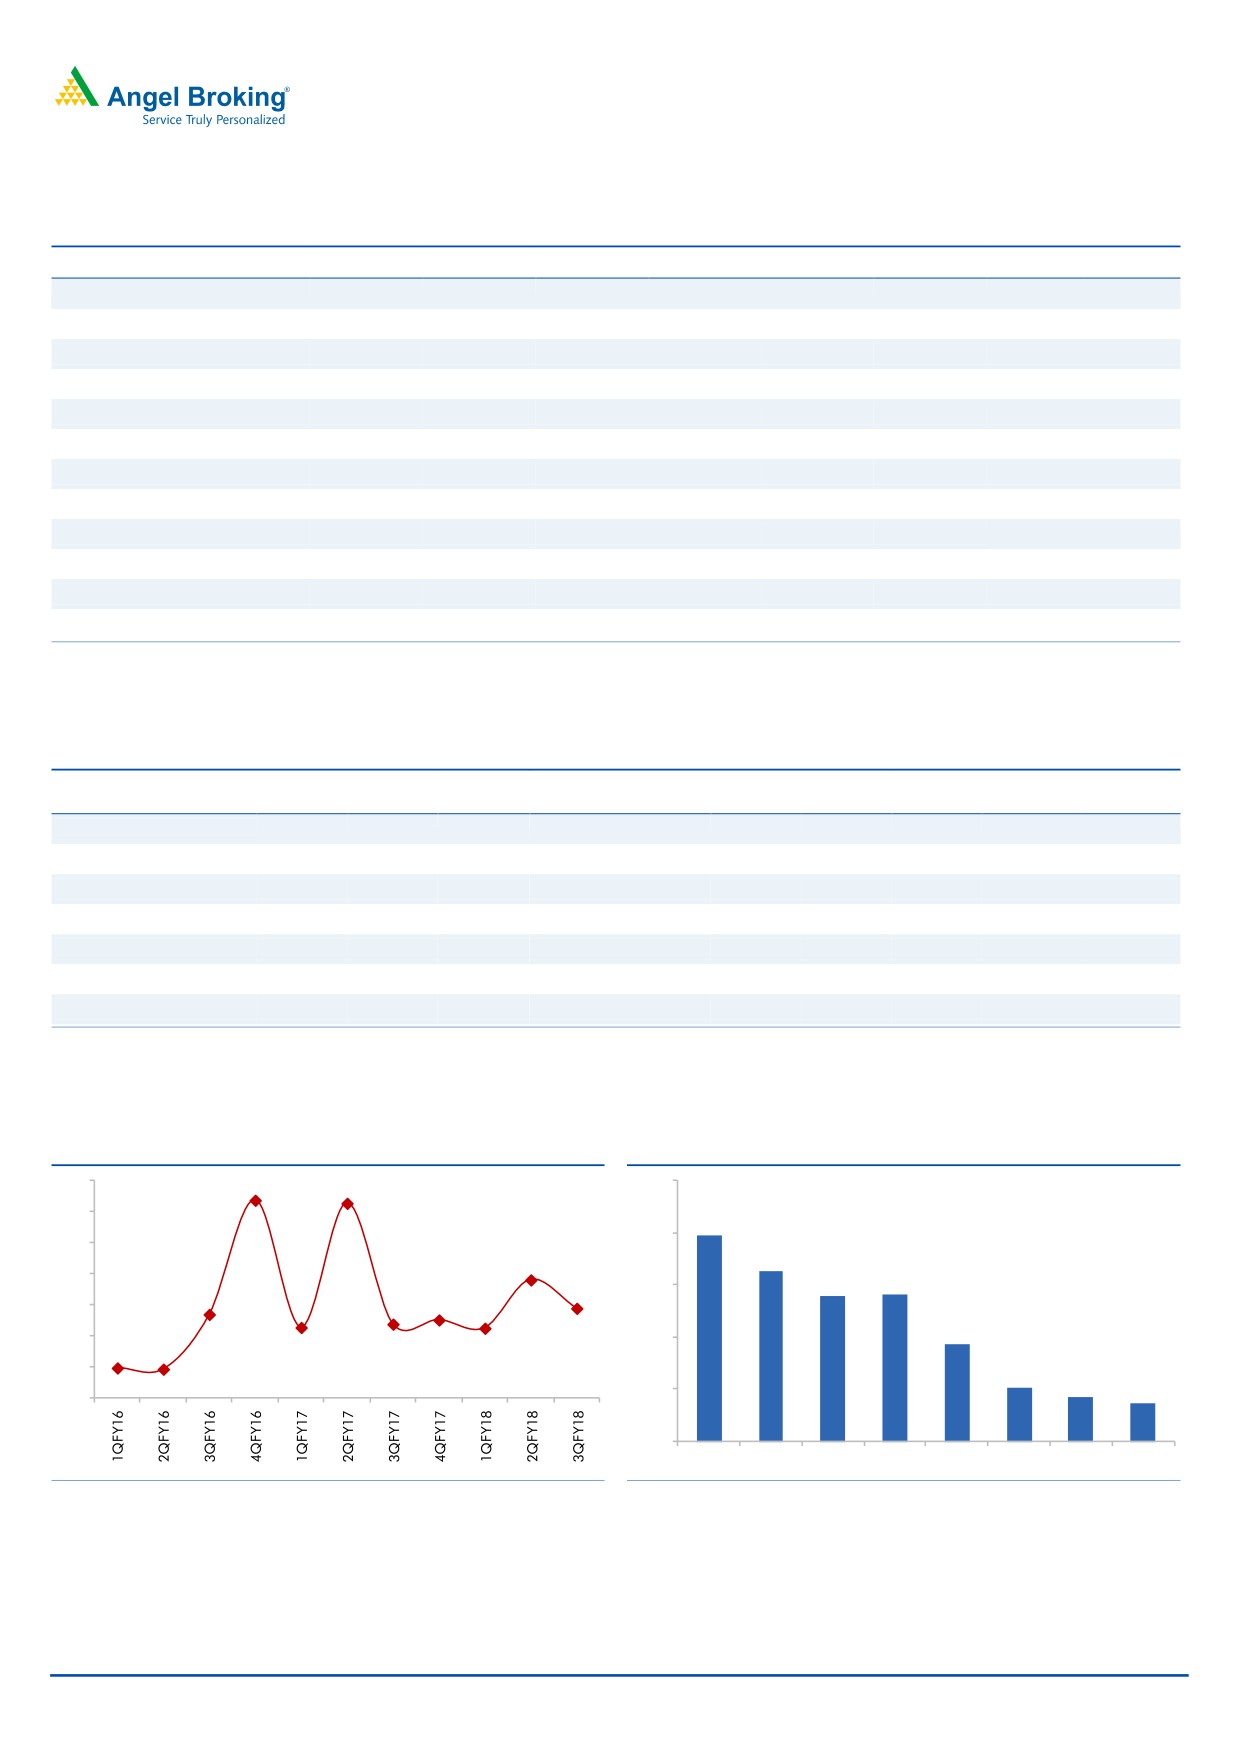
Exhibit 5: Credit costs (%) declined sequentially
Exhibit 6: SR stayed stable qoq at 0.4% of loans
7.0
6.4
6.3
2.5
6.0
2.0
2.0
5.0
3.8
1.6
4.0
1.4
1.4
2.9
1.5
2.7
3.0
2.3
2.4
2.5
2.2
0.9
2.0
1.0
1.0
0.9
1.0
0.5
0.4
0.5
0.4
0.0
-
4QFY16 1QFY17 2QFY17 3QFY17 4QFY17 1QFY18 2QFY18 3QFY18
Source: Company, Angel Research
Source: Company, Angel Research, SR- Standard Restructured
February 15, 2018
3
ICICI Bank | Q3FY2018 Result Update
Exhibit 7: SOTP valuation summary
Valuation
Particulars
%
Value/share (`)
Methodology
Value of ICICI standalone
100
1.8x FY20E ABV
301
Subsidiaries
ICICI Prudential Life
55
On Current M.Cap
50
General Insurance
56
On Current M.Cap
32
Mutual Fund
51
8% of current AUM
18
Other (Home Fin, VC, Securities PD and
43
Overseas subsidiaries)
Total subsidiaries' value @ 20% discount
115
Fair value per share
416
Source: Company, Angel Research
Outlook & Valuation: At the current market price, the bank’s core banking
business (after adjusting value of subsidiaries) is trading at 1.1x FY20E ABV. We
believe strength of liability franchise (CASA-50%), shift in loan mix towards retail
assets and better rated companies, Strong capitalization (tier I of 14.6%), and
steady improvement in stress loan and going forward quick resolution under IBC
would be the key trigger for multiple expansion. We recommend a Buy rating on
the stock, with a target price of `416.
February 15, 2018
4
ICICI Bank | Q3FY2018 Result Update
Exhibit 8: Income statement (Standalone)
Y/E March (` cr)
FY15
FY16
FY17
FY18E
FY19E
FY20E
Net Interest Income
19,040
21,224
21,738
22,992
26,390
30,871
- YoY Growth (%)
16
11
2
6
15
17
Other Income
12,175
15,323
19,503
15,586
16,631
19,292
- YoY Growth (%)
17
26
27
(20)
7
16
Operating Income
31,215
36,547
41,241
38,578
43,021
50,164
- YoY Growth (%)
16
17
13
(6)
12
17
Operating Expenses
11,496
12,684
14,754
15,691
18,029
20,811
- YoY Growth (%)
12
10
16
6
15
15
Pre - Provision Profit
19,719
23,863
26,487
22,887
24,992
29,352
- YoY Growth (%)
19
21
11
(14)
9
17
Prov. & Cont.
3,900
11,668
15,207
14,372
12,139
9,920
- YoY Growth (%)
48
199
30
(5)
(16)
(18)
Profit Before Tax
15,819
12,196
11,279
8,515
12,852
19,432
- YoY Growth (%)
13.2
(23)
(8)
(25)
51
51
Prov. for Taxation
4,645
2,469
1,478
789
3,470
5,247
- as a % of PBT
29
20
13
9
27
27
PAT
11,174
9,726
9,802
7,726
9,382
14,185
- YoY Growth (%)
14
(13)
1
(21)
21.4
51
Exhibit 9: Balance sheet (Standalone)
Y/E March (` cr)
FY15
FY16
FY17
FY18E
FY19E
FY20E
Equity
1,167
1,170
1,171
1,290
1,290
1,290
Reserve & Surplus
79,262
88,566
98,780
1,04,249
1,11,755
1,23,104
Networth
80,429
89,736
99,951
1,05,540
1,13,046
1,24,394
Deposits
3,61,563
4,21,426
4,90,039
5,43,943
6,20,095
7,13,110
- Growth (%)
9
17
16
11
14
15
Borrowings
1,72,417
1,74,807
1,47,556
1,59,361
1,80,078
2,05,288
Other Liab. & Prov.
31,720
34,726
34,245
32,945
58,210
81,448
Total Liabilities
6,46,129
7,20,695
7,71,791
8,41,789
9,71,428
11,24,240
Cash Balances
25,653
27,106
31,702
33,963
38,718
44,526
Bank Balances
16,652
32,763
44,011
24,411
27,829
32,003
Investments
1,86,580
1,60,412
1,61,507
1,87,801
2,15,483
2,48,872
Advances
3,87,522
4,35,264
4,64,232
5,19,940
6,03,130
6,99,631
- Growth (%)
14
12
7
12
16
16
Fixed Assets
4,726
7,577
7,805
8,279
9,437
10,853
Other Assets
24,997
57,574
62,535
67,395
76,831
88,355
Total Assets
6,46,129
7,20,695
7,71,791
8,41,789
9,71,428
11,24,240
- Growth (%)
12
7
9
15
16
February 15, 2018
5
ICICI Bank | Q3FY2018 Result Update
Exhibit 10: Ratio analysis (Standalone)
Y/E March
FY15
FY16
FY17
FY18E
FY19E
FY20E
Profitability ratios (%)
NIMs
3.2
3.3
3.2
3.1
3.2
3.2
Cost to Income Ratio
37
35
36
41
42
41
RoA
1.8
1.4
1.3
1.0
1.0
1.4
RoE
15
11
10
8
9
12
B/S ratios (%)
CASA Ratio
45
46
50
50
50
50
Credit/Deposit Ratio
1.07
1.03
0.95
0.96
0.97
0.98
Asset Quality (%)
Gross NPAs
3.3
5.2
7.9
7.7
6.7
5.3
Net NPAs
1.4
2.7
4.9
3.1
2.7
2.1
Slippages
2.2
4.2
7.5
4.0
3.0
2.0
Loan Loss Prov. /Avg. Assets
0.63
1.71
2.04
1.78
1.34
0.95
Provision Coverage
41
50
60
60
60
60
Per Share Data (`)
EPS
17
15
15
12
15
22
ABVPS (75% cover.)
103
112
116
138
149
167
DPS
5
5
2
2
3
4
Valuation Ratios
PER (x)
19
22
22
27
22
15
P/ABVPS (x)
3.2
2.9
2.8
2.4
2.2
2.0
Dividend Yield (%)
1.4
1.4
0.7
0.7
0.9
1.3
DuPont Analysis
Int Income
7.9
7.7
7.3
6.8
6.9
7.0
Int Exp
4.8
4.6
4.3
4.0
4.0
4.0
NII
3.1
3.1
2.9
2.8
2.9
2.9
(-) Prov. Exp.
0.6
1.7
2.0
1.8
1.3
0.9
Adj. NII
2.4
1.4
0.9
1.1
1.6
2.0
Other Inc.
2.0
2.2
2.6
1.9
1.8
1.8
Op. Inc.
4.4
3.6
3.5
3.0
3.4
3.8
Opex
1.9
1.9
2.0
1.9
2.0
2.0
PBT
2.5
1.8
1.5
1.1
1.4
1.9
Taxes
0.7
0.4
0.2
0.1
0.4
0.5
RoA
1.8
1.4
1.3
1.0
1.0
1.4
Leverage
8.1
8.0
7.9
7.9
8.3
8.8
RoE
14.5
11.4
10.3
7.5
8.6
11.9
Source: Note - Valuation done on closing price of 15/02/2018
February 15, 2018
6
ICICI Bank | Q3FY2018 Result Update
Research Team Tel: 022 - 39357800
DISCLAIMER
Angel Broking Private Limited (hereinafter referred to as “Angel”) is a registered Member of National Stock Exchange of India Limited,
Bombay Stock Exchange Limited and Metropolitan Stock Exchange Limited. It is also registered as a Depository Participant with CDSL
and Portfolio Manager and Investment Adviser with SEBI. It also has registration with AMFI as a Mutual Fund Distributor. Angel Broking
Private Limited is a registered entity with SEBI for Research Analyst in terms of SEBI (Research Analyst) Regulations, 2014 vide
registration number INH000000164. Angel or its associates has not been debarred/ suspended by SEBI or any other regulatory
authority for accessing /dealing in securities Market. Angel or its associates/analyst has not received any compensation / managed or
co-managed public offering of securities of the company covered by Analyst during the past twelve months.
This document is solely for the personal information of the recipient, and must not be singularly used as the basis of any investment
decision. Nothing in this document should be construed as investment or financial advice. Each recipient of this document should
make such investigations as they deem necessary to arrive at an independent evaluation of an investment in the securities of the
companies referred to in this document (including the merits and risks involved), and should consult their own advisors to determine
the merits and risks of such an investment.
Reports based on technical and derivative analysis center on studying charts of a stock's price movement, outstanding positions and
trading volume, as opposed to focusing on a company's fundamentals and, as such, may not match with a report on a company's
fundamentals. Investors are advised to refer the Fundamental and Technical Research Reports available on our website to evaluate the
contrary view, if any
The information in this document has been printed on the basis of publicly available information, internal data and other reliable
sources believed to be true, but we do not represent that it is accurate or complete and it should not be relied on as such, as this
document is for general guidance only. Angel Broking Pvt. Limited or any of its affiliates/ group companies shall not be in any way
responsible for any loss or damage that may arise to any person from any inadvertent error in the information contained in this report.
Angel Broking Pvt. Limited has not independently verified all the information contained within this document. Accordingly, we cannot
testify, nor make any representation or warranty, express or implied, to the accuracy, contents or data contained within this document.
While Angel Broking Pvt. Limited endeavors to update on a reasonable basis the information discussed in this material, there may be
regulatory, compliance, or other reasons that prevent us from doing so.
This document is being supplied to you solely for your information, and its contents, information or data may not be reproduced,
redistributed or passed on, directly or indirectly.
Neither Angel Broking Pvt. Limited, nor its directors, employees or affiliates shall be liable for any loss or damage that may arise from
or in connection with the use of this information.
Disclosure of Interest Statement
ICICI Bank
1. Analyst ownership of the stock
No
2. Angel and its Group companies ownership of the stock
No
3. Angel and its Group companies' Directors ownership of the stock
No
4. Broking relationship with company covered
No
Note: We have not considered any Exposure below ` 1 lakh for Angel, its Group companies and Directors
February 15, 2018
7
Ratings (Based on expected returns
Buy (> 15%)
Accumulate (5% to 15%)
Neutral (-5 to 5%)
over 12 months investment period):
Reduce (-5% to -15%)
Sell (< -15)